Column: The retirement crisis is real and frightening, as these six charts show
Is the “retirement crisis” just a scare story? That’s what conservatives would like you to believe as they rail against proposals from progressives in Congress to expand and increase Social Security.
Andrew Biggs, a former Social Security official, wrote recently in the conservative National Review that there’s no need to expand Social Security benefits because “Americans’ retirement incomes and retirement savings have never been stronger.”
That may be true, in the aggregate. But the question is: whose retirement incomes and savings? Monique Morrissey of the labor-supported Economic Policy Institute presents evidence that, just as income inequality for those in their working years has soared, so has inequality in the distribution of retirement resources.
The trends...paint a picture of increasingly inadequate retirement savings for successive generations of Americans—and large disparities by income, race, ethnicity, education, and marital status.
— Monique Morrissey, Economic Policy Institute
Morrissey’s findings are presented in a series of charts, six of which we offer here. For the most part the underlying figures are updates of those she published in 2016, which we reported on at the time. Her figures, which then covered years up to 2013, now go up to 2016.
She writes that “the trends ... paint a picture of increasingly inadequate retirement savings for successive generations of Americans — and large disparities by income, race, ethnicity, education, and marital status.”
It’s proper to note that Morrissey and Biggs aren’t measuring exactly the same things. Biggs bases his analysis largely on projections of “replacement rates,” the proportion of working-year income covered in retirement by savings, Social Security and employee pensions.
He asserts that these are rising and will continue to do so as Gen-Xers--those now between 45 and 53 years old -- move into retirement. Social Security Administration estimates cited by Biggs indicate that the median retirement income for today’s 80- and 90-year-olds is 111% of pre-retirement income, but for Gen-X it will be 115%, which doesn’t “indicate anything like the retirement crisis that Americans are being told they face,” he writes.
Yet median figures don’t tell us whether the overall increase in retirement security will be enjoyed more at the top of the income and wealth scale -- a sharp tilt in favor of the affluent would be largely masked by the median.
Biggs writes that in all age groups measured by a Federal Reserve study he cites, “retirement savings have at least doubled relative to the salaries those savings must replace once Americans retire” -- rising from 232% of work income among households aged 55 to 69 in 1989 to 471% for the same age group in 2016.
Biggs told me by email that the Fed figures indicate that improvements in replacement rates show up across the income range (though he didn’t offer the income breakdown in his published article).
Still, if income and wealth inequality are affecting Americans working today, how will that change for them as they retire? That’s the issue raised by Morrissey’s evidence, so let’s take a look.
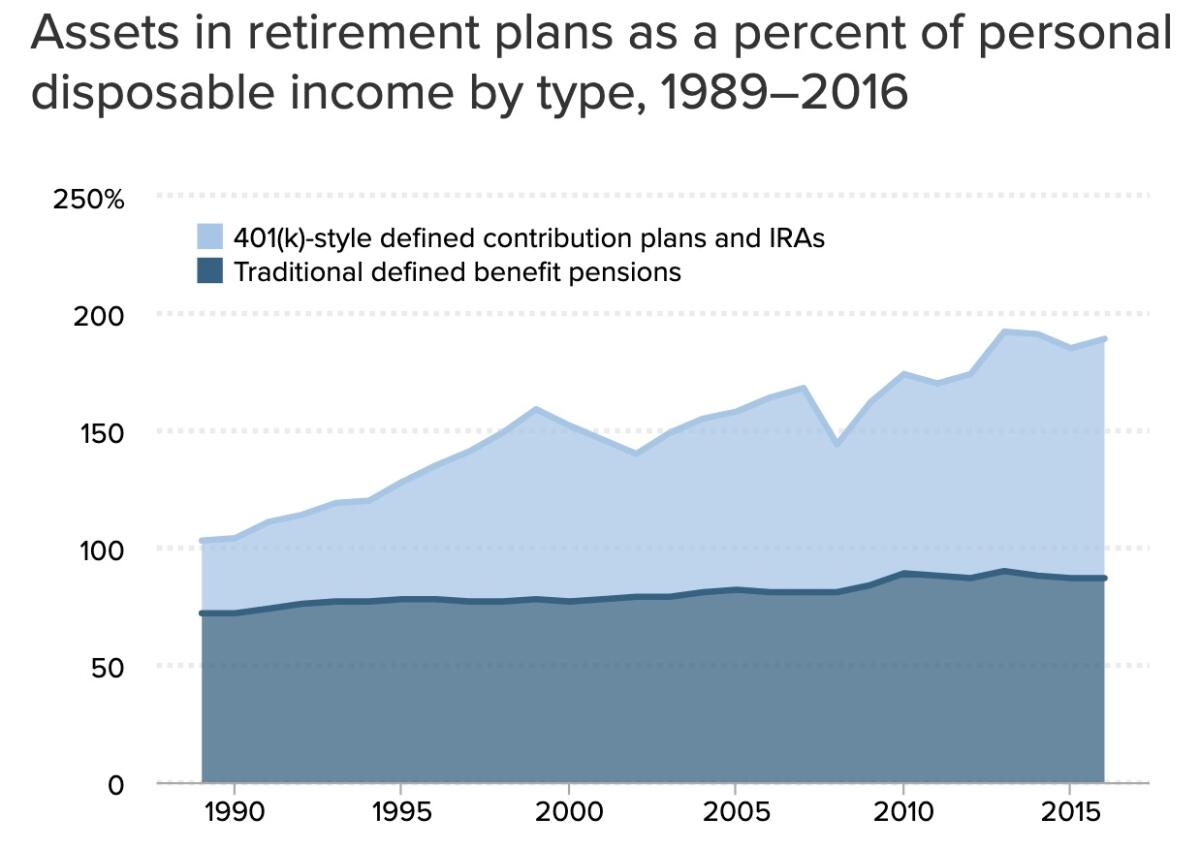
Morrissey’s first chart, shown above, validates Biggs’ point that overall retirement assets have grown -- in fact, almost doubled as a share of personal income from 1989 to 2016. That’s largely because of the advent of 401(k)-style defined contribution plans, through which workers invest a portion of their own wages in investment accounts they manage themselves (sometimes with additional sums from employers).
The chart displays some reason for disquiet, however. Defined contribution plans are much more vulnerable to market downturns than traditional pensions, as retirees and near-retirees discovered in the 2001 and 2008 crashes visible in the jagged top line.
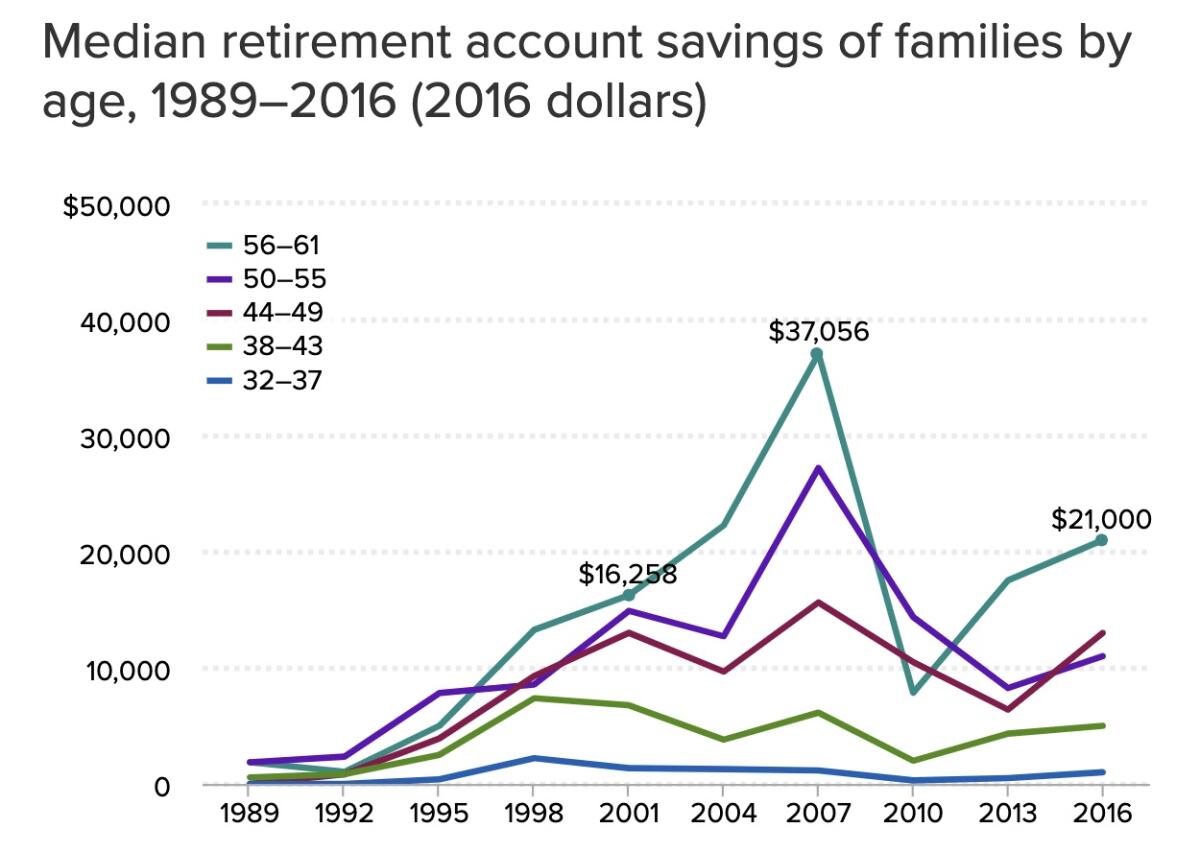
Half of all families have no savings at all, bringing down median values for all (that’s the point at which half of all samples are below and half above). Even among those nearing retirement, median savings are only $21,000, a steep reduction from more than $37,000 just before the last crash.
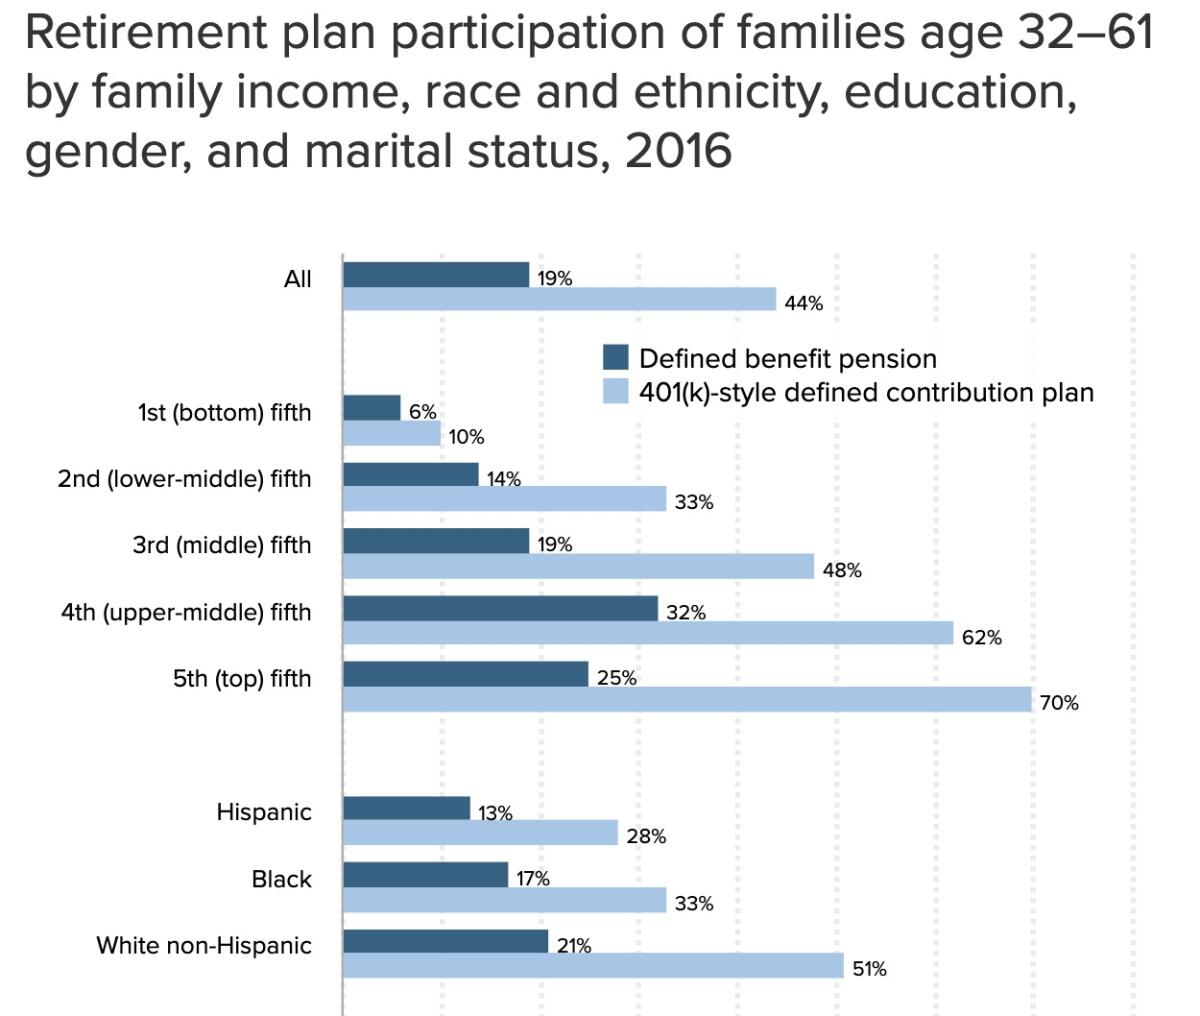
Although 401(k)-type plans are supplanting traditional pensions in the workplace, participation in the voluntary defined contribution plans is skewed toward higher-income workers, who participate at much higher rates than their lower-income colleagues, possibly because lower-income workers find it harder to set aside a portion of their current income to make contributions. Participation is also ethnically uneven, with white workers taking advantage of 401(k) plan offers more than black or Latino workers.
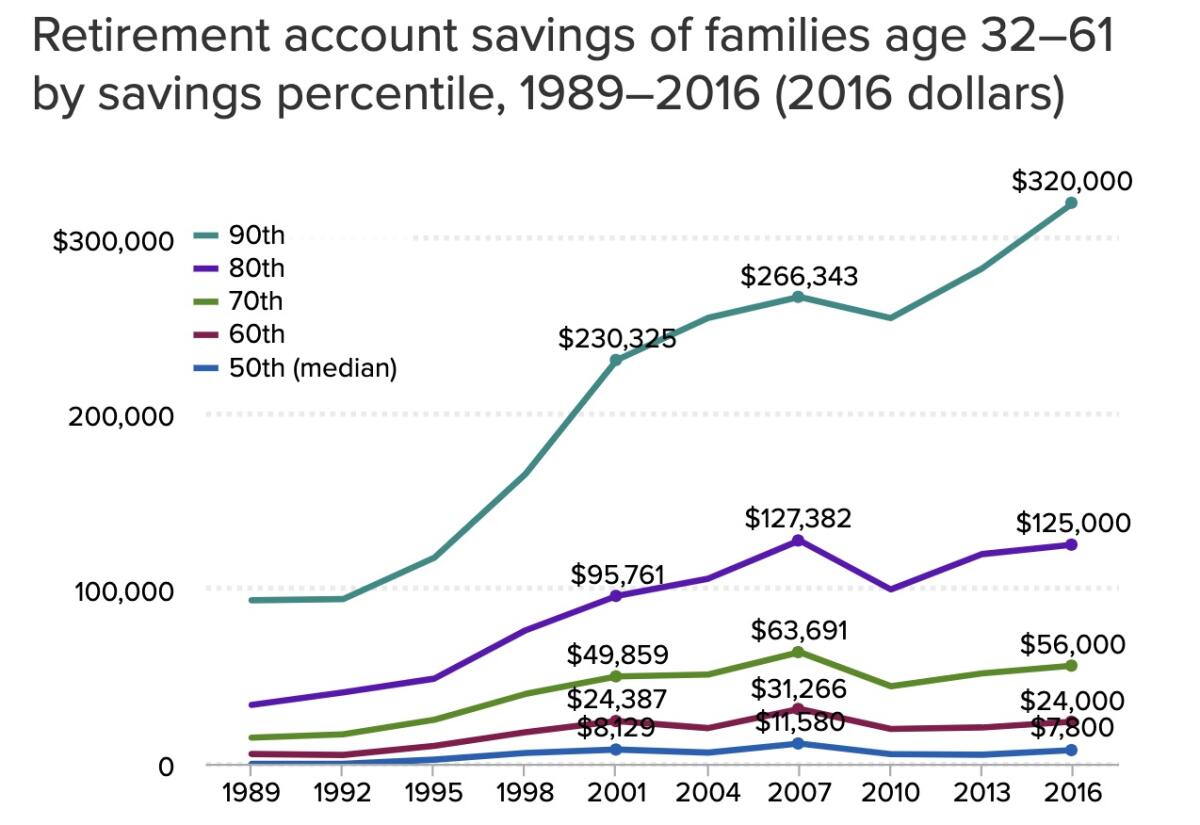
Morrissey observes that “the gap between the retirement ‘haves’ and ‘have-nots’ has grown since the recession,” with median working families holding savings of only $7,800 in 2016. The 90th percentile of savers, however, experienced a rebound in their accounts since 2008.
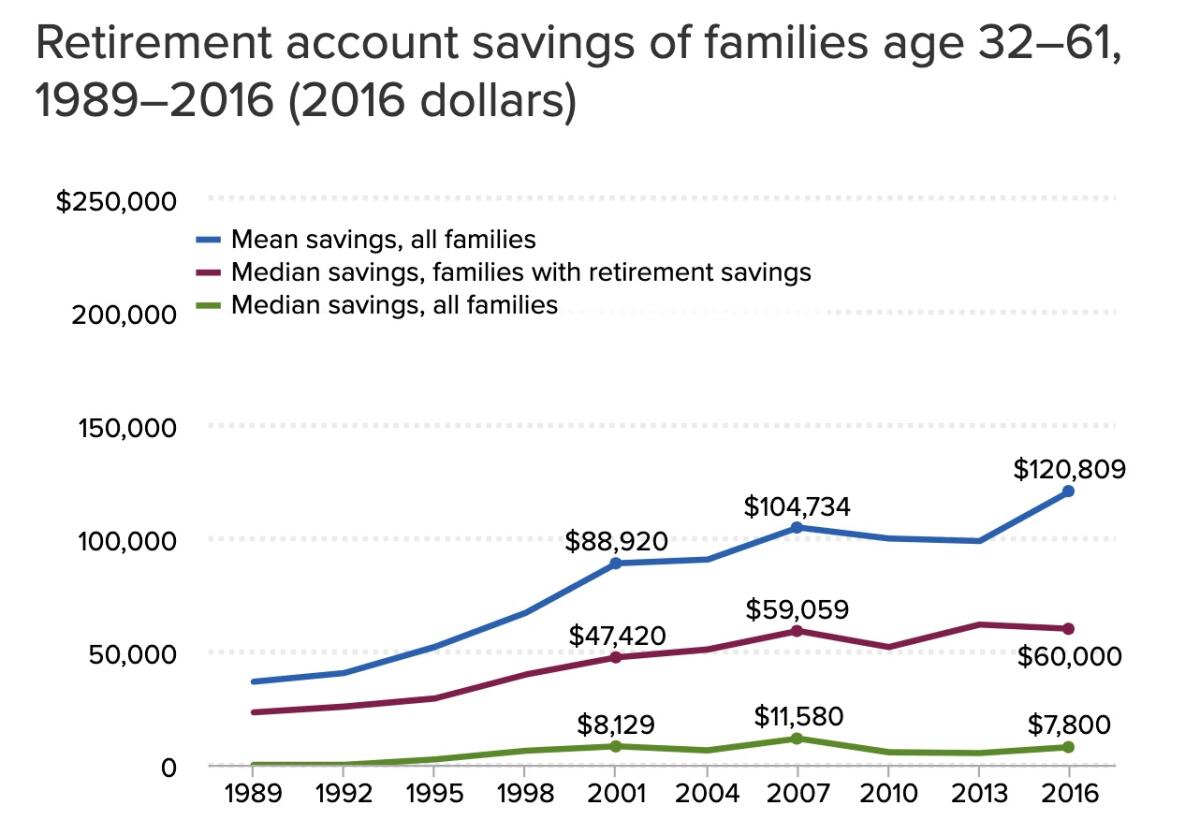
The trend toward increasing concentration of retirement assets at the top can be seen in the above chart, which shows that while average, or mean, savings have risen, median savings have remained flat. That reflects how disproportionate gains among wealthier workers drive up the mean, but leave behind most working households.
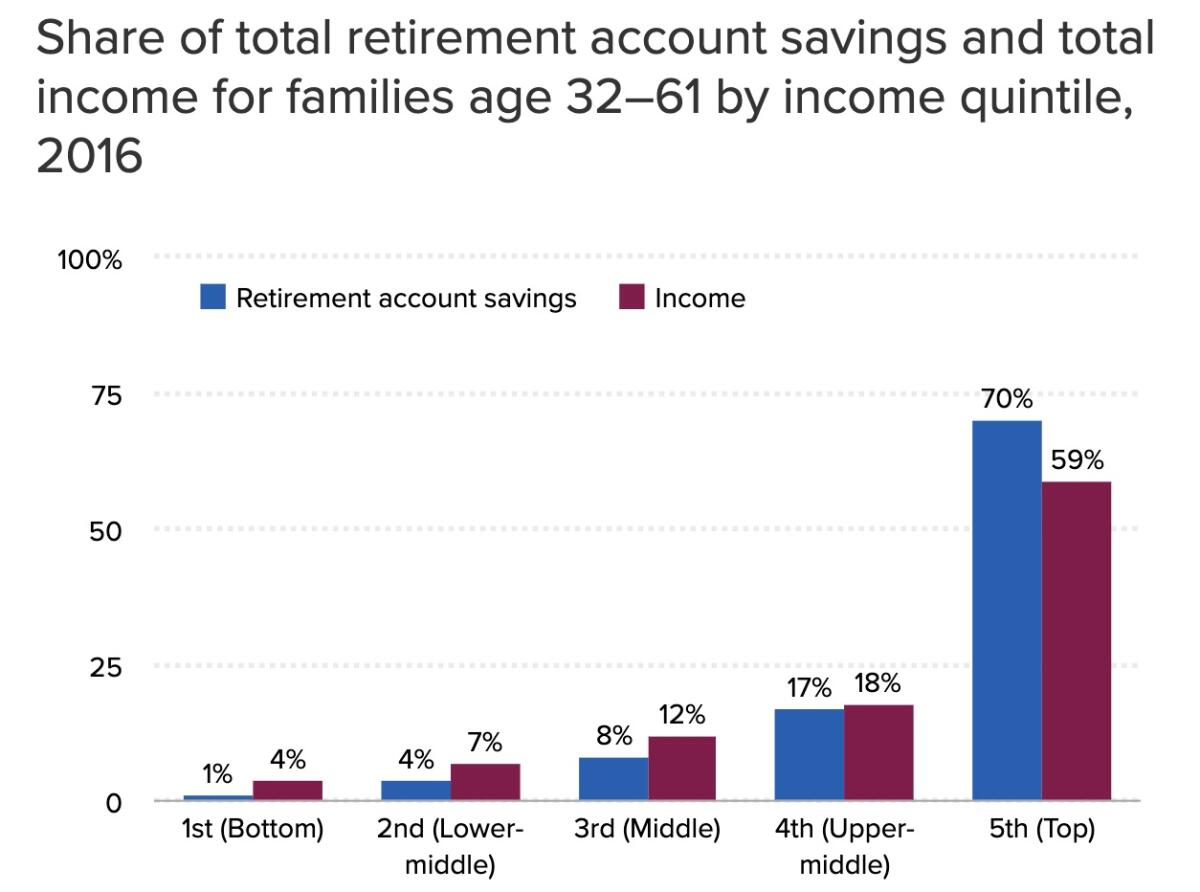
The ultimate harvest can be seen in the chart below. It shows that the top 20% of families have 70% of retirement savings, while the bottom 80% have a combined share of 30% and the lowest fifth have only 1% of the total. That reflects the outsize share of income received by the top fifth, but also indicates that wealth inequality grows worse in retirement.
What all these figures suggest is that the wealth of today’s retirees tells us almost nothing about what faces tomorrow’s retirees. Today’s retirees were able to build their nest eggs during a period in which America’s economic growth was shared much more fairly than it is now. Today’s workers have experienced stagnant earnings growth, which makes it harder not merely to make ends meet but to save for the future.
Today’s retirees may not be living a crisis, but the picture is much darker for tomorrow’s. The crisis may be lurking just over the horizon.


