How to read and understand air quality numbers and maps


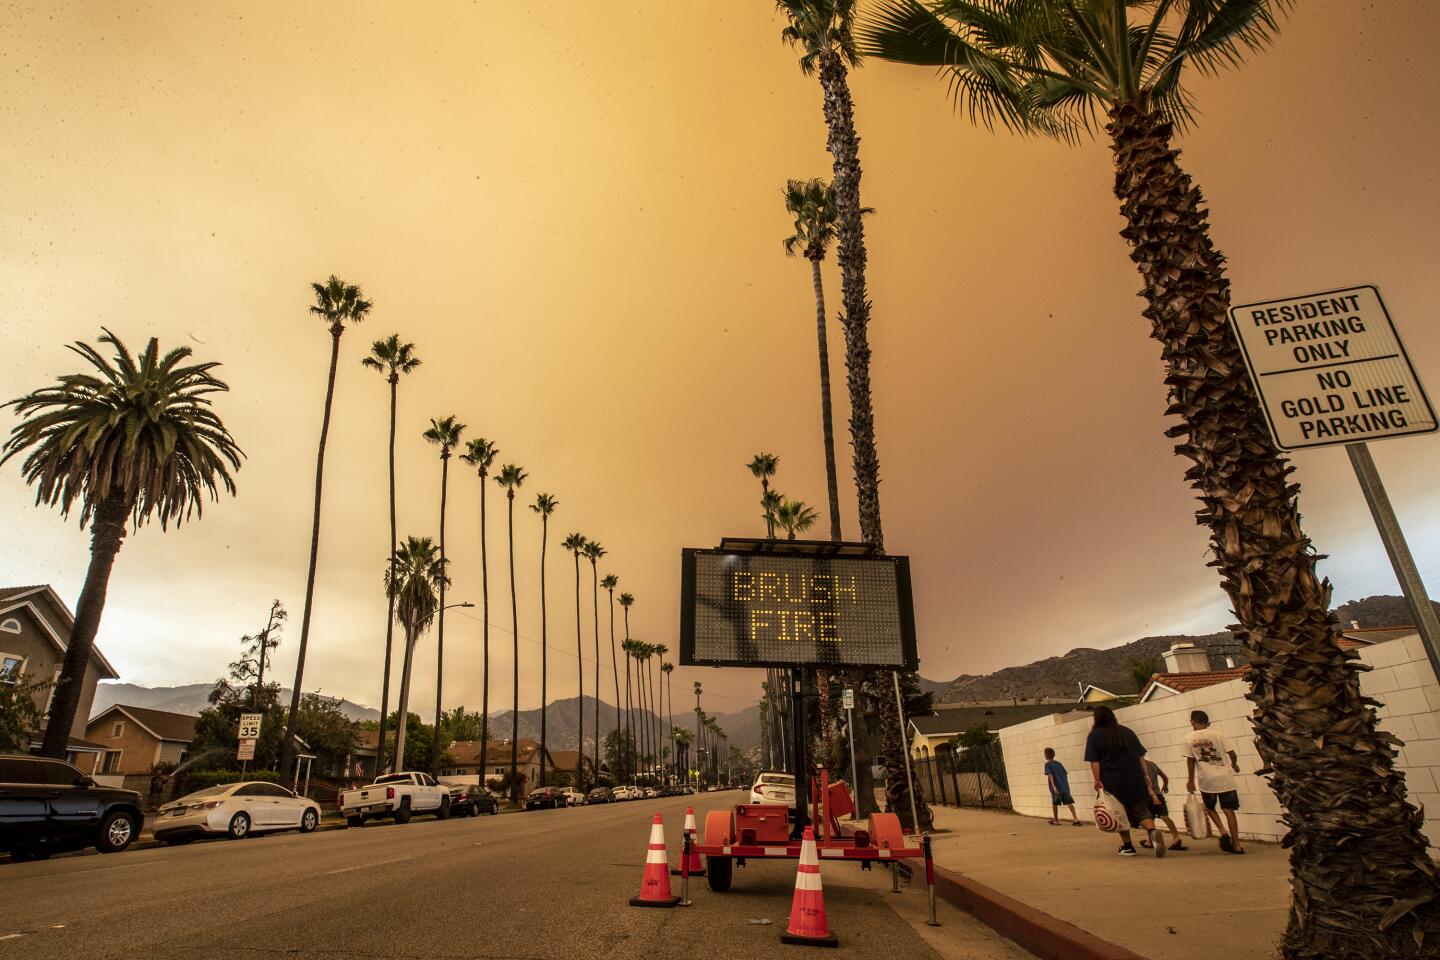
There’s smoke and ash outside. You feel like you’re inhaling tiny dust particles. You check your weather app for the air quality.
But what do the numbers and colors mean?
The Air Quality Index is a number from 0 to 500 that indicates the health effects certain individuals might experience while breathing. The higher the number, the more polluted the air.
The AQI is divided into six categories, each assigned a color, from green (under 50, posing little to no risk) to dark red (greater than 300, hazardous for everyone). The categories in the middle take into consideration various sensitivities to poor air quality; for example, in children, the elderly and people with conditions such as asthma.
- Green/Good (0 to 50): Air quality is considered satisfactory, and air pollution poses little or no risk.
- Yellow/Moderate (51 to 100): Air quality is acceptable; however, unusually sensitive people should consider limiting prolonged outdoor exertion.
- Orange/Unhealthy for Sensitive Groups (101 to 150): The following groups should limit prolonged or heavy outdoor exertion: People with heart disease, pregnant women, children and older adults and people with lung disease such as asthma.
- Red/Unhealthy (151 to 200): Everyone may begin to experience some adverse health effects (such as difficulty breathing and throat irritation), and members of the sensitive groups may experience more serious effects. Everyone in the sensitive groups should avoid prolonged time outdoors.
- Purple/Very Unhealthy (201 to 300): This would generate a health alert suggesting that everyone may experience more serious health effects. People in the sensitive groups should avoid all outdoor physical activity; everyone else should avoid prolonged or heavy outdoor activity.
- Dark Red/Hazardous (greater than 300): This would trigger a health warning of emergency conditions. The entire population is more likely to be affected. Everyone should avoid all physical activity outdoors.
“Once you get above 101, even people without environmental sensitivities and existing respiratory illnesses will start to feel an impact,” said Tyler Knowlton, director of communications at Plume Labs, which developed the Plume AQI, which Accuweather uses for maps showing global air quality. That index takes into consideration World Health Organization guidelines, and its categories go from “Fresh Air” to “Airpocalypse” (which was the reading Friday evening in Portland, Ore.).
The Environmental Protection Agency calculates the standard AQI based on five major air pollutants regulated by the Clean Air Act: ground-level ozone, particle pollution (also known as particulate matter), carbon monoxide, sulfur dioxide and nitrogen dioxide.
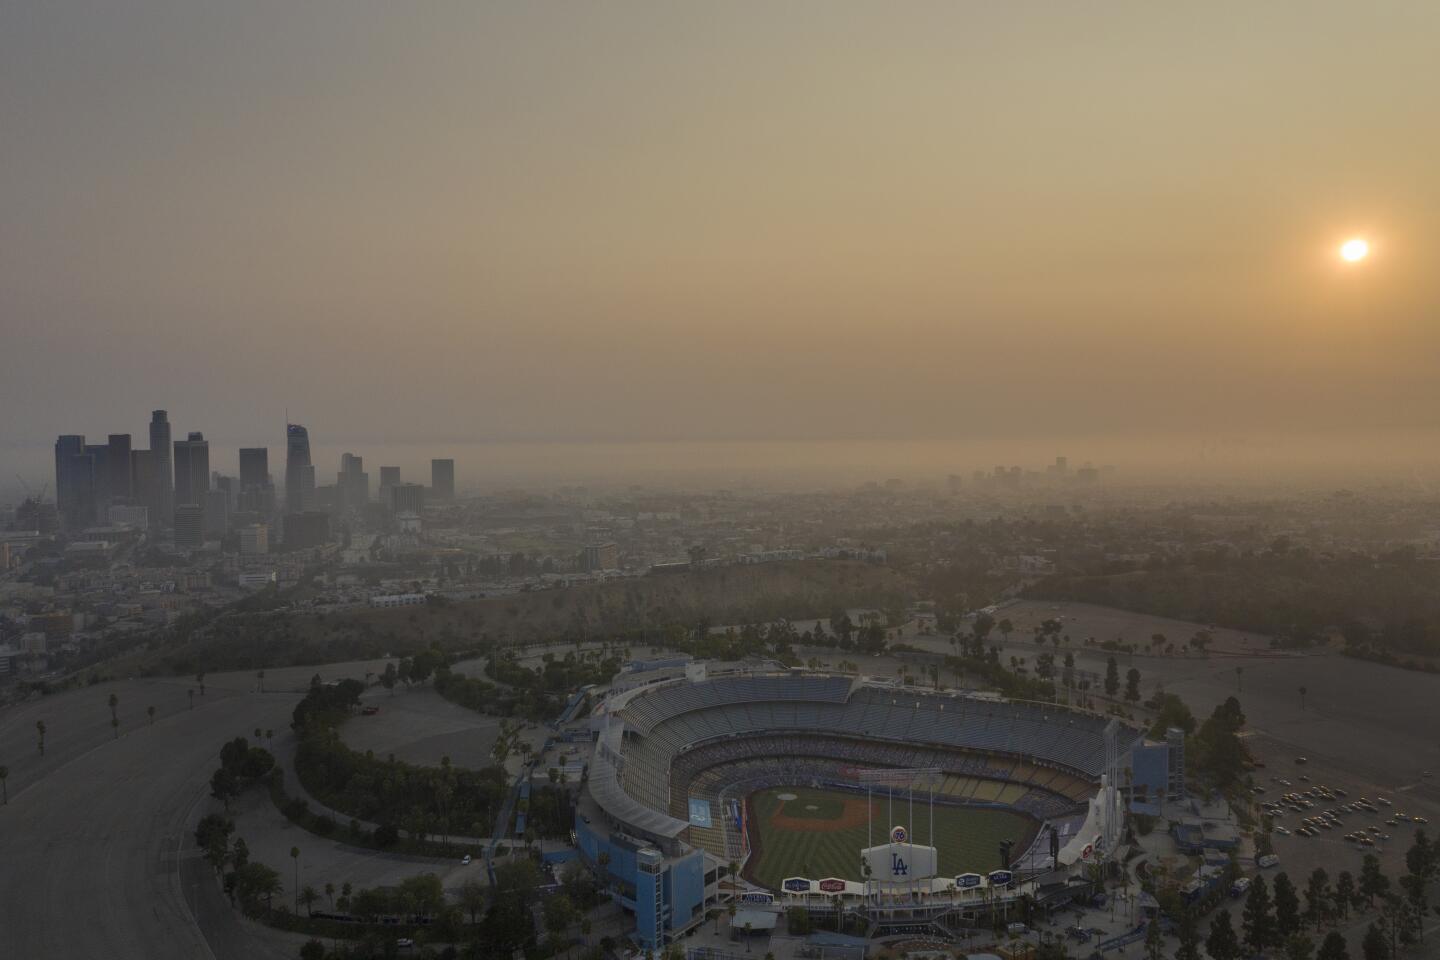
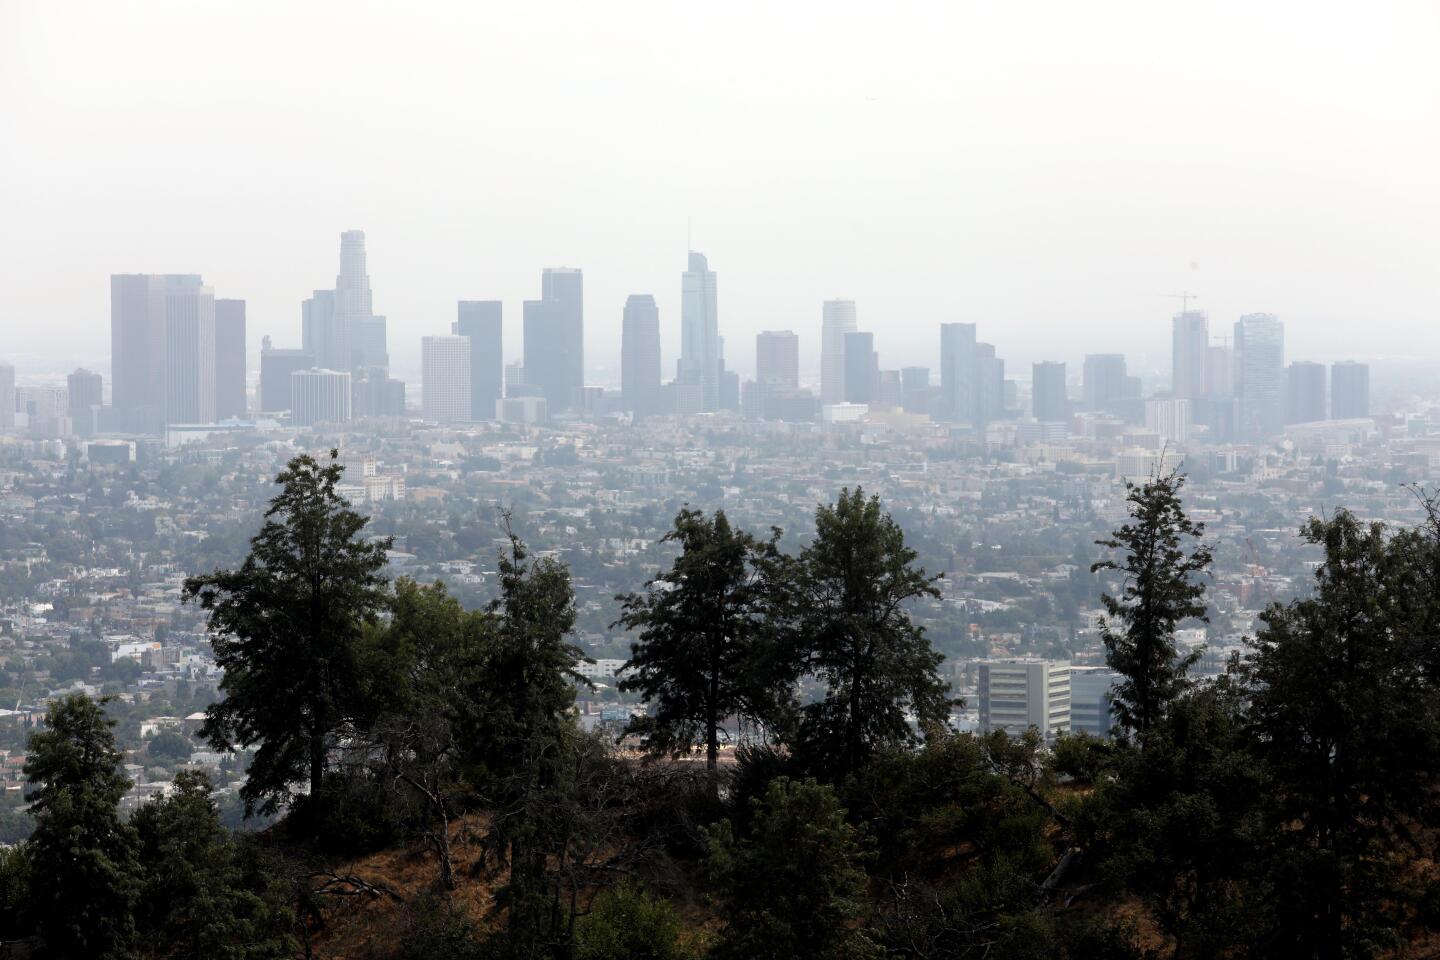
The most dangerous — and what accounts for the smog in California — are ground-level ozone (created by chemical reactions when pollutants emitted by cars, power plants and chemical plants react with sunlight) and particulate matter, or PM.
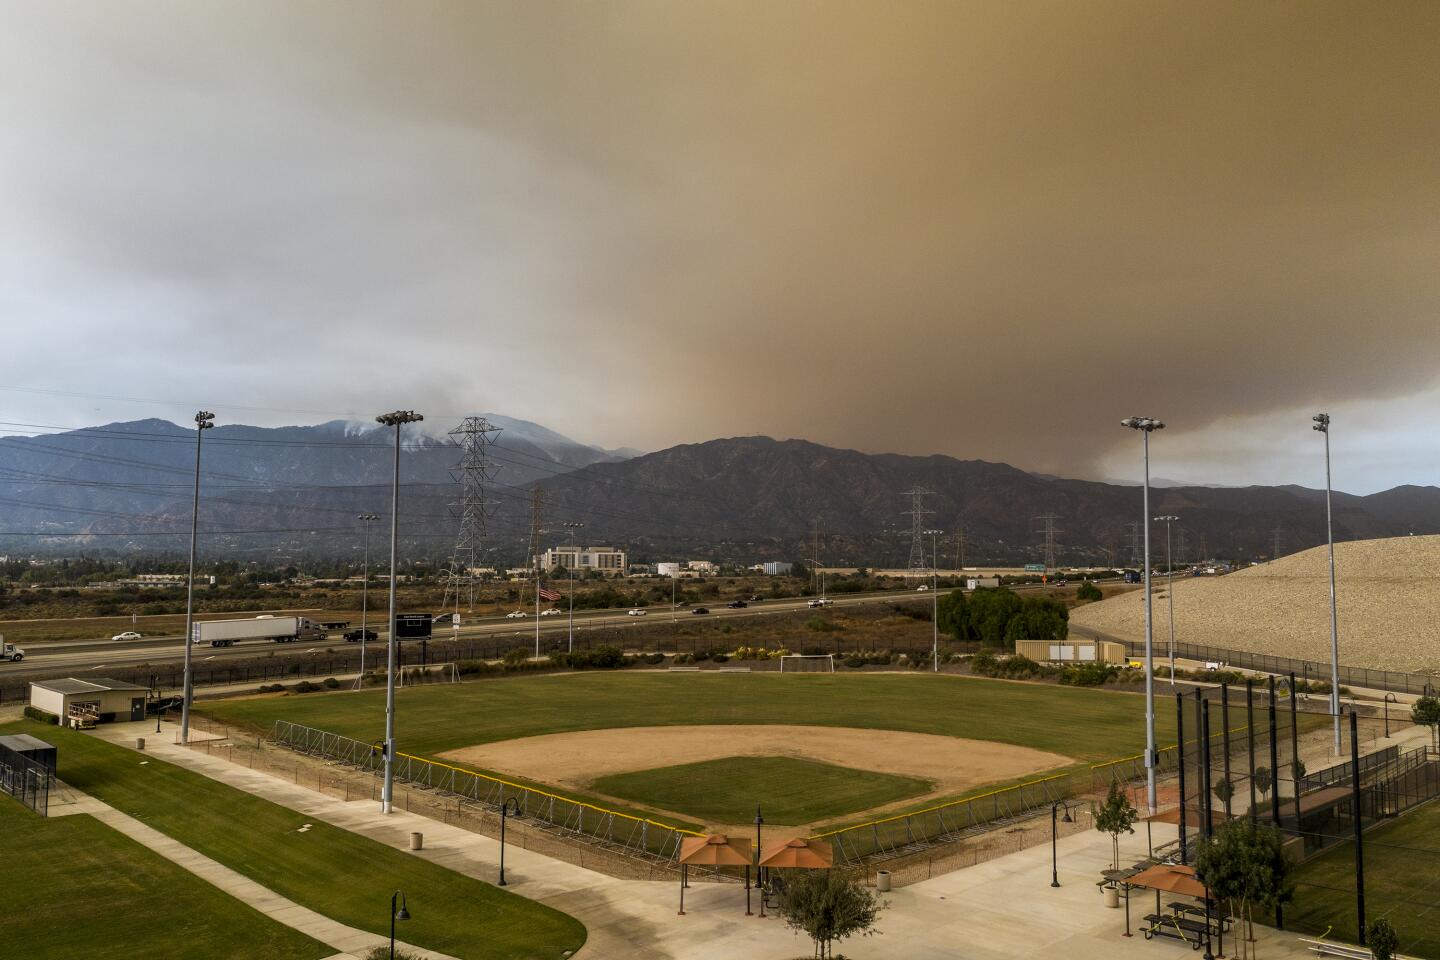
PM10 and PM2.5 describe the sizes of PM, referring to their maximum diameter in micrometers. According to Nahal Mogharabi, director of communications at the South Coast Air Quality Management District, PM2.5 from the wildfires is driving the AQI in most cases this week.
Romain Lacombe, chief executive of Plume Labs, explained that PM2.5 molecules are small enough to enter the lungs and even the bloodstream.
“PM2.5 are small, inhalable particles, smaller than a human hair, that are emitted from a variety of sources such as wildfires, vehicles, fugitive dust and industrial sources,” said Mogharabi. “The PM2.5 can also be formed in the atmosphere from the reaction of gases emitted from these same sources.”

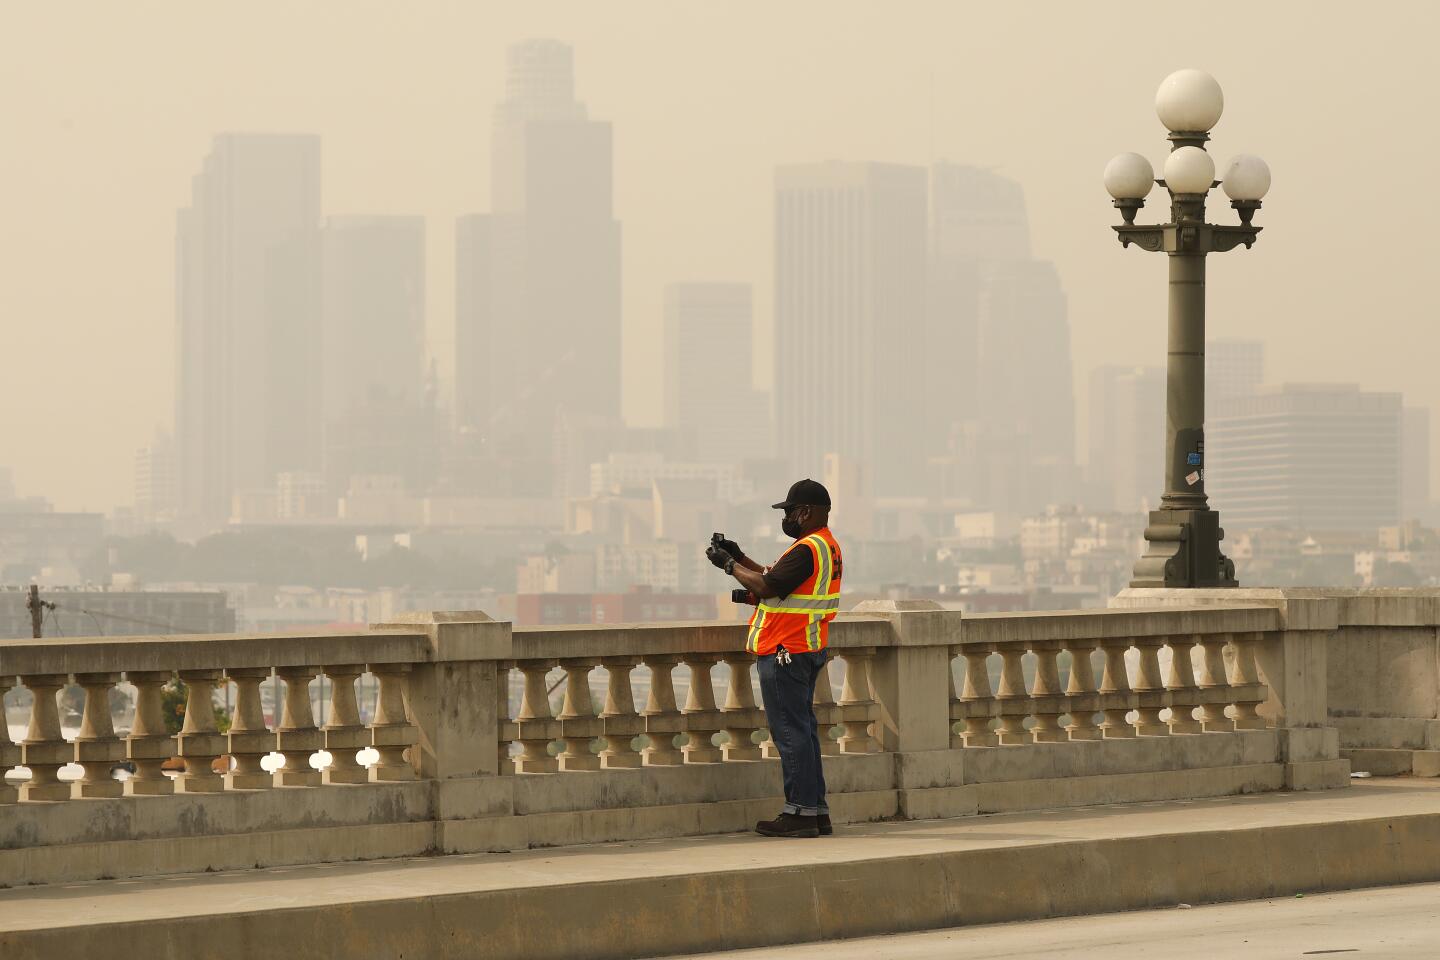
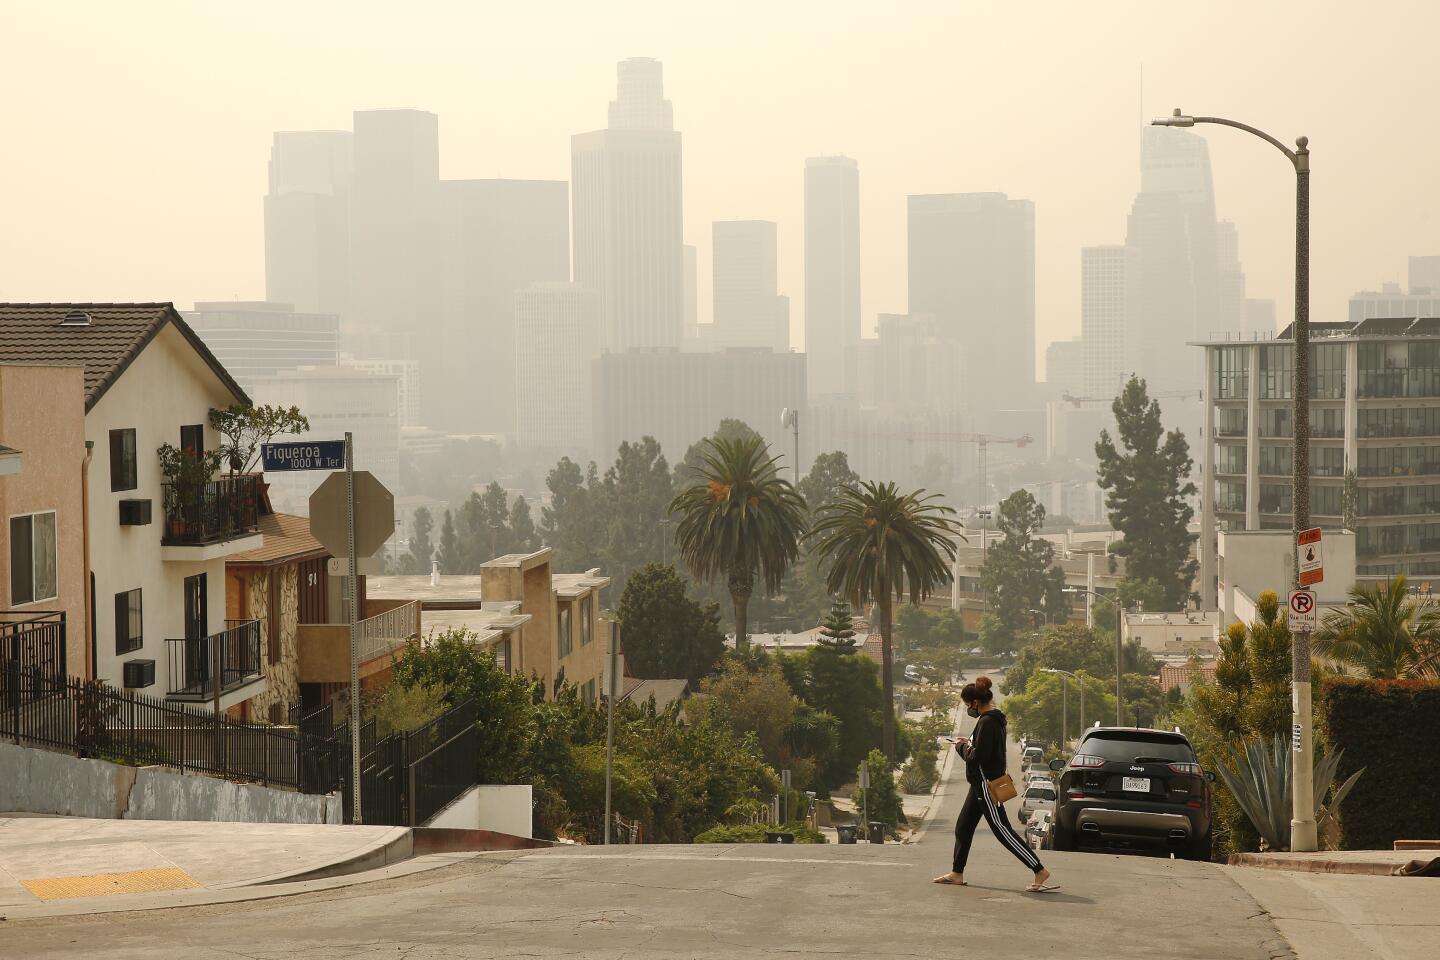
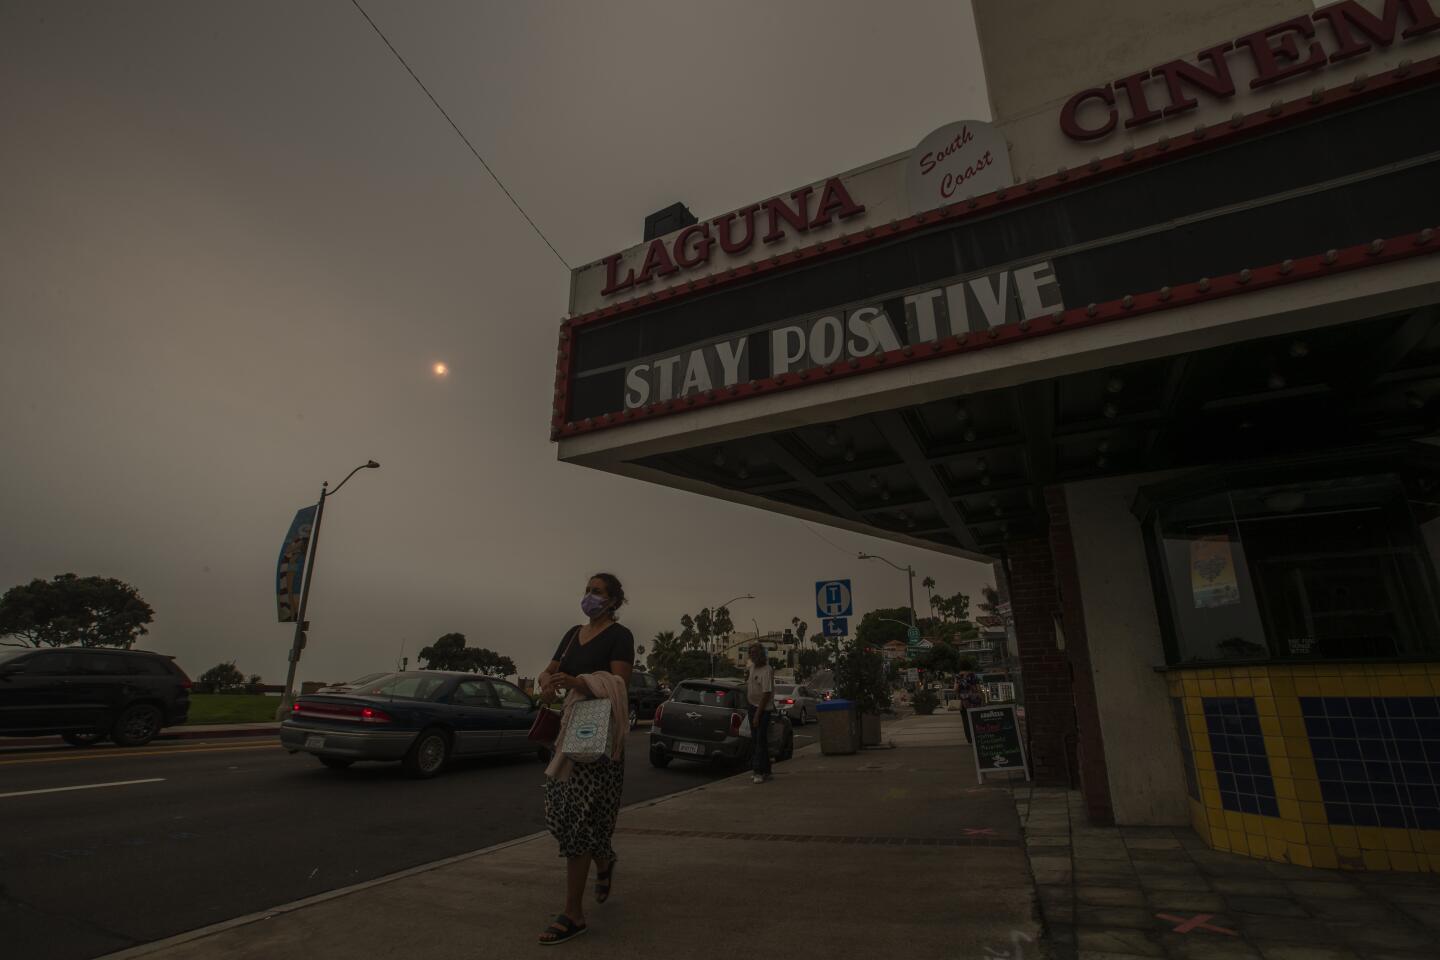
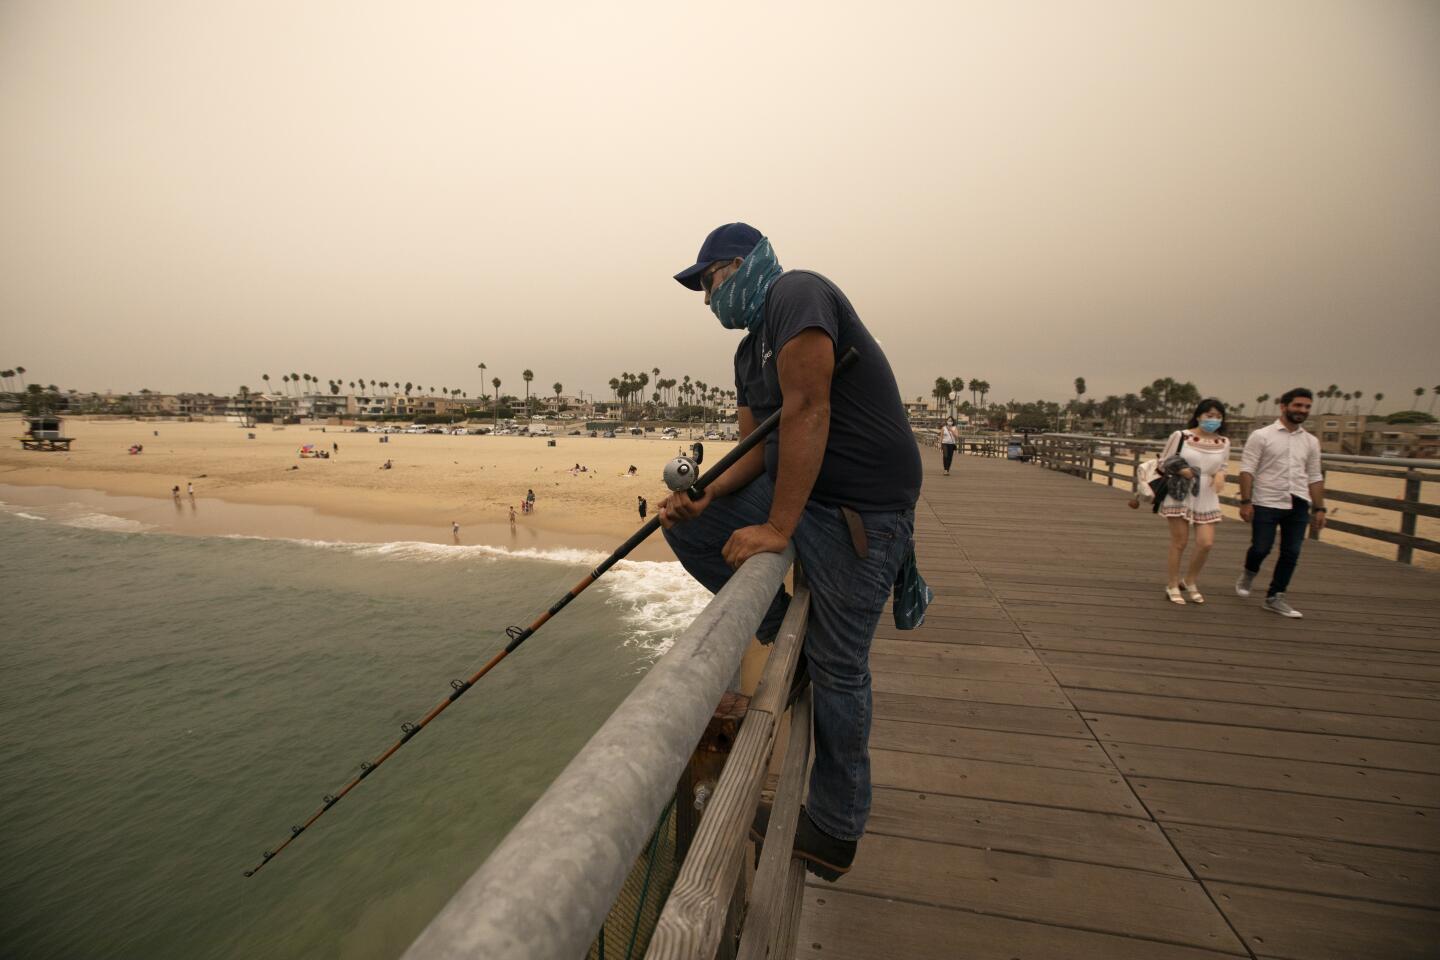
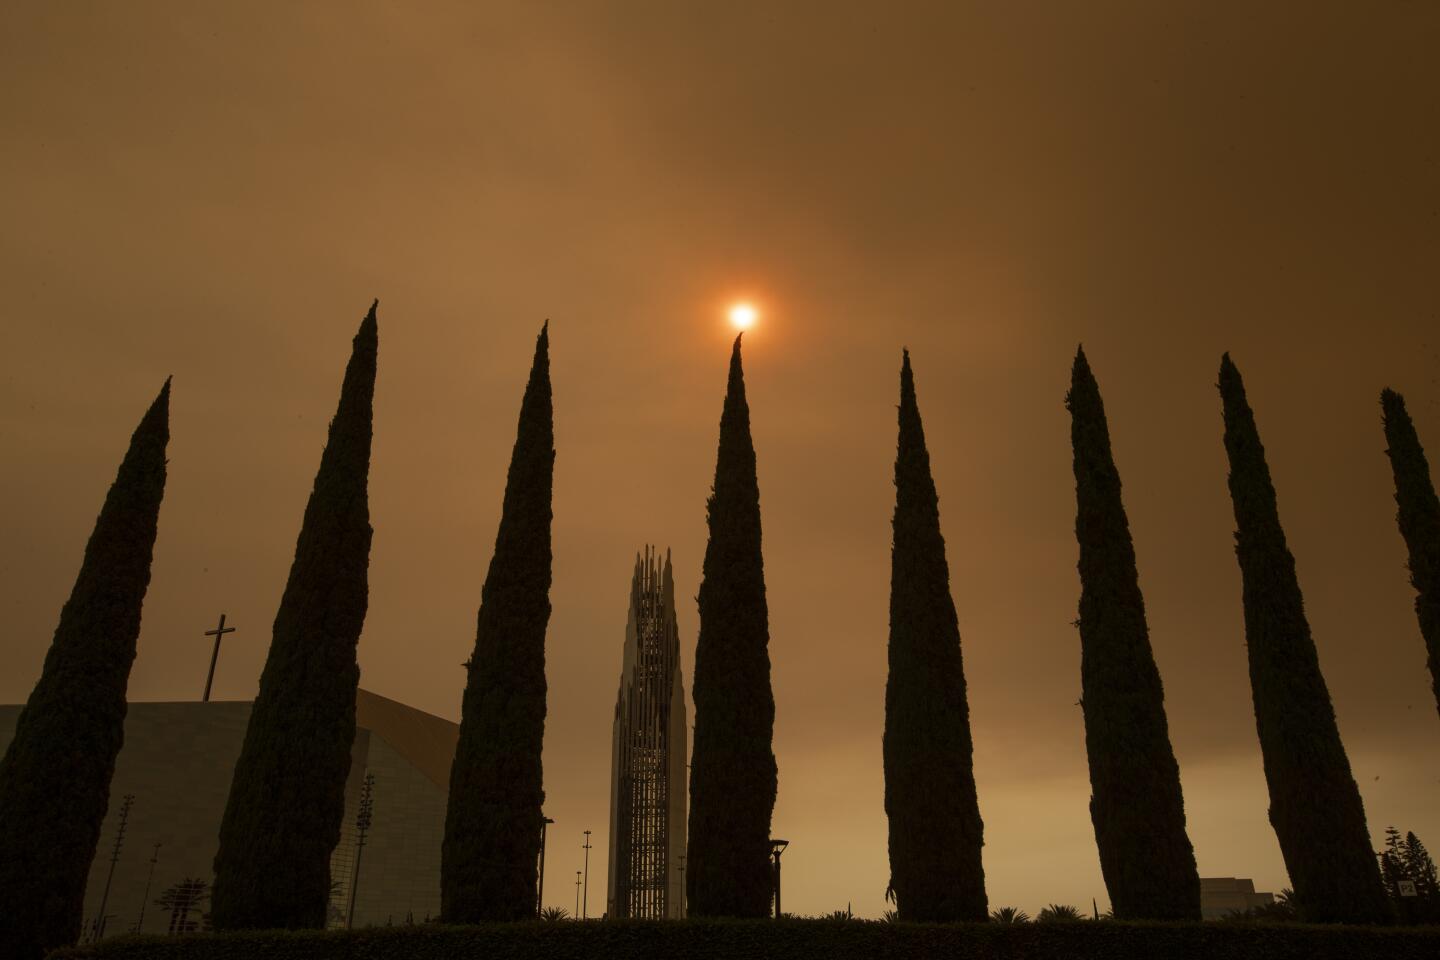
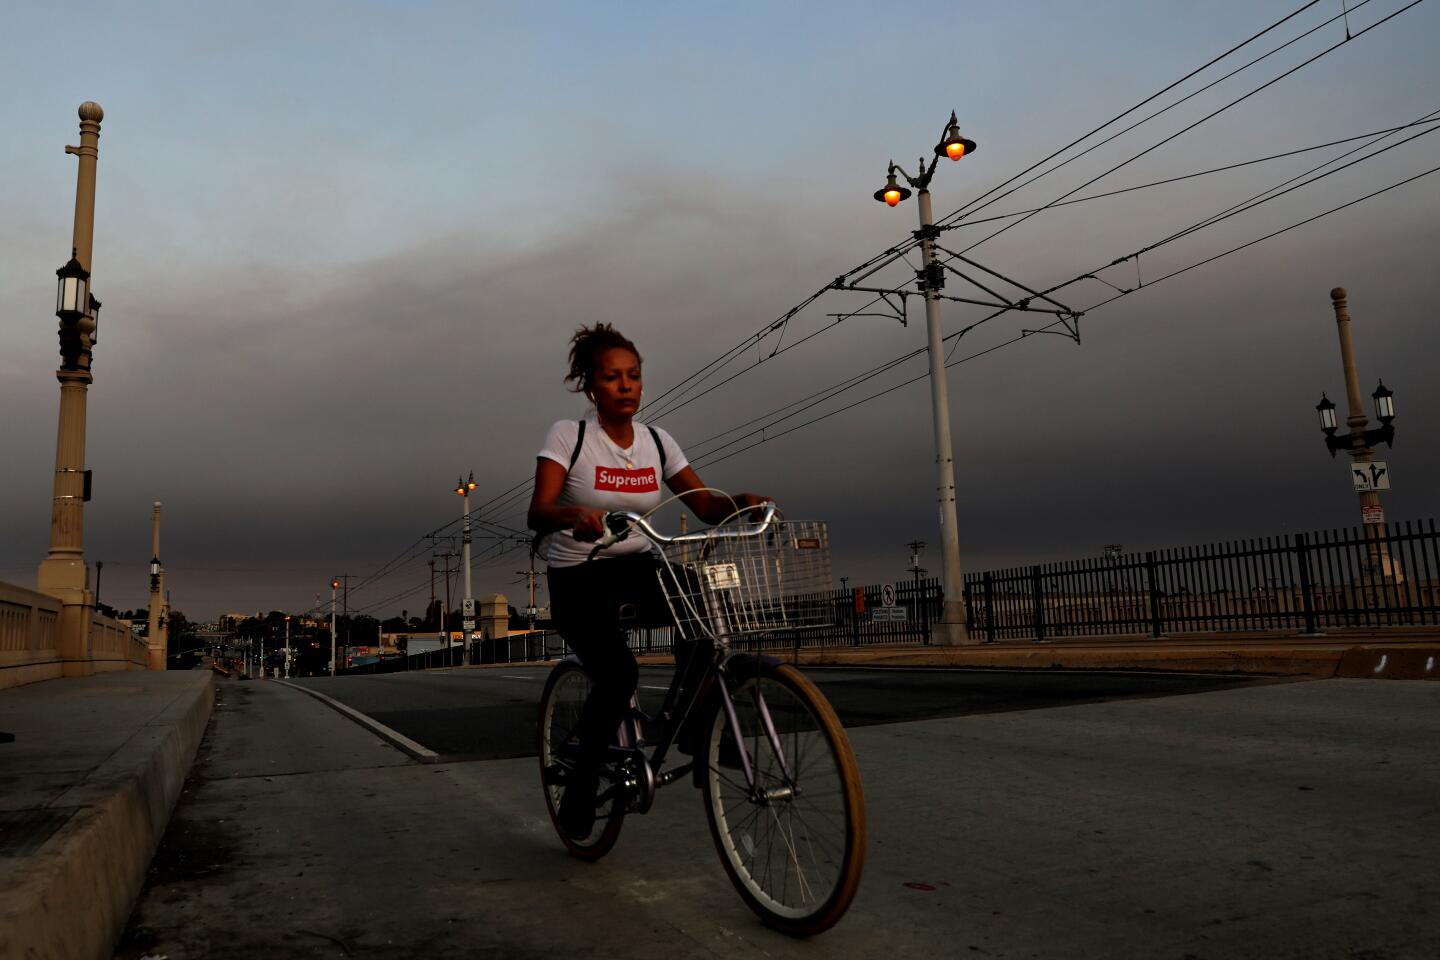
The air around Southern California feels like smoke soup because of wildfires. What does that mean for your health and daily routines?
The AQI across Los Angeles hovered in the mid-100s Friday afternoon, or “unhealthy for sensitive groups.” The forecast for the next few days is in the 200s, which would be categorized as “very unhealthy,” meaning everyone should avoid prolonged outdoor activity.
Lacombe recommends looking at AQI forecasts to get a sense of the general trend, but he warns that the numbers can be misleading. Weather patterns can result in quick changes, and even neighboring cities can have very different readings, he said.
South Coast AQMD encourages people to check its website, aqmd.gov, or download its smartphone app for real-time air quality information.
“As always, if you see ash or smell smoke, we encourage the public to stay indoors with their windows and doors closed,” said Mogharabi.


Start your day right
Sign up for Essential California for news, features and recommendations from the L.A. Times and beyond in your inbox six days a week.
You may occasionally receive promotional content from the Los Angeles Times.