Why California went its own liberal way in the election

- Share via
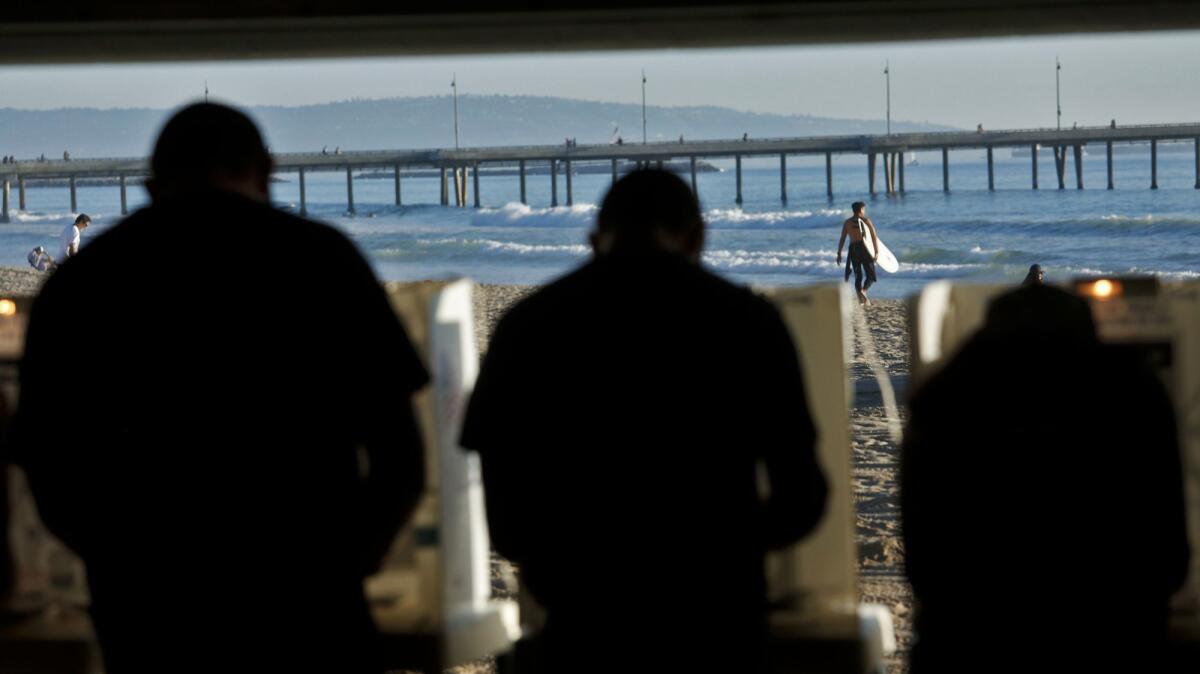
Reporting from Washington — As Hillary Clinton’s national popular vote margin over President-elect Donald Trump grows — swelled in large part by California’s prolonged ballot count — a new poll details how much more liberal the state has become compared with the rest of the country and why it was so much more receptive to the Democrat.
The USC Dornsife/Los Angeles Times post-election poll of California voters, conducted by SurveyMonkey, also shows that majorities of California’s Democrats and Republicans would like to see Trump and congressional Democrats compromise on major issues.
For the record:
2:15 p.m. Nov. 16, 2016An earlier version of this article said that out of 50 states and the District of Columbia, 35 were decided by 10 points or more. The correct number is 34.
But on both sides, voters largely expect the other to do the compromising. That’s an indication of the pressures that push both parties toward confrontations that voters dislike in theory, but often demand in practice.
Clinton leads Trump by about 1.2 million votes nationwide, a margin that has grown steadily since election day.
Vote counting continues in many states, as election officials sort through provisional ballots, late-arriving mail-in votes and other stragglers. By far the largest chunk of uncounted ballots remains in California, some 3.5 million as of Wednesday, compared with about 10.5 million statewide that had been counted.
By law, officials in California count mail-in ballots that arrive up to three working days after the election so long as they were postmarked by election day — a leeway that most states don’t allow and all but guarantees a slower count.
With Clinton beating Trump by almost 2-1 in California, her national margin will almost certainly grow and is likely to surpass 2 million.
But although Clinton has racked up similarly large majorities in some other Democratic strongholds, she lost where the race was close, accounting for her defeat in electoral votes.
Out of 50 states and the District of Columbia, 34 were blowouts, with the contest decided by 10 points or more, according to data compiled by Dave Wasserman of the Cook Political Report. Of the 17 closer contests, 10 fell Trump’s way.
Trump tweeted this week that if the election had depended on the popular vote, not the electoral college, he would have campaigned differently and won the popular vote. On the flip side, many Democrats argue that if the country abolished the electoral college system, which awards votes to the winner of each state, Clinton would have won.
Both claims are inherently unprovable. A different campaign run under different rules would have yielded different results.
California’s vote differs so much from the national pattern for two main reasons: Nonwhite voters, a group that is heavily Democratic, make up a significantly bigger share of the state’s electorate than the national one. Moreover, the state’s white voters are more likely to define themselves as liberals and identify with Democrats than are whites in the rest of the country.
In California, white voters made up about 56% of the state’s electorate, the USC/LA Times survey indicated. Clinton carried those white voters 55% to 40%, blacks by 84% to 13%, Latinos by 73% to 22% and all other voters by 57% to 35%, the survey found.
By contrast, a separate national post-election poll by SurveyMonkey found whites made up 75% of the electorate across the country.
Clinton lost to Trump among white voters nationally by 17 percentage points, the poll found. Her margins among blacks and Latinos nationwide were roughly similar to those in California, given the error margins for both surveys: 90% to 8% among African Americans and 67% to 28% among Latinos.
Nationally, about a quarter of whites identified themselves as liberal or very liberal, while 42% called themselves conservative or very conservative and 35% called themselves moderates, the SurveyMonkey poll found. In California, whites split roughly into thirds: liberal or very liberal, conservative or very conservative and moderate, the poll found.
Consistently through the campaign, Trump was strongest with blue-collar whites — those who did not graduate from college. California’s white population has fewer non-college-educated members than in most states, and they are less conservative.
Nationally, Trump won blue-collar whites 64% to 32%; in California, the split was just nine points, the poll found. Among white college graduates, the SurveyMonkey national survey showed Clinton winning by 10 points, while in California, her margin was much larger, 69% to 26%.
Clinton won among both men and women in California — with men by 16 percentage points and women by 39 points, the poll found. By contrast, she won women’s votes nationally by 14 points and lost among men by the same margin, the SurveyMonkey national poll found.
Looking ahead to the new administration, roughly two-thirds of California voters said that they wanted Democrats in Congress to compromise, rather than try to block Trump’s agenda. And three-quarters said they wanted Trump to compromise rather than stand his ground and block the Democrats’ agenda.
But that professed desire for compromise could be misleading.
Among Republicans, only 35% said Trump should compromise, while 63% said he should stand his ground. Republicans by 94% to 4% wanted Democrats in Congress to compromise.
Democrats showed a similar, although slightly more tempered, desire for the other side to do most of the compromising. They divided almost evenly on whether Democrats in Congress should compromise with Trump. But by 97% to 3%, they said Trump should compromise with Democrats.
Perhaps not surprisingly, the state’s voters weren’t hugely optimistic about the prospects. Only 15% said they thought it “very likely” that Trump would be able to “work effectively with the Democrats in Congress.” Another 25% said that was somewhat likely, but 59% thought it unlikely.
Republicans, reflecting their faith in the man they voted for, were more likely to say they expected him to work effectively with Democrats, with 81% saying they thought that was at least somewhat likely.
The poll also showed how much more focused Trump’s voters were on a few key issues than were Clinton’s.
Among voters who sided with Trump, 40% in California and 46% nationwide listed jobs and the economy as their top issue, and 19% statewide and 13% nationally cited immigration.
Clinton voters were more divided, with 25% in California and 30% nationwide listing jobs and the economy. Environmental issues, healthcare and foreign policy each were listed by about one in eight Clinton voters in California as their top issue.
The poll’s estimates of how the vote divided nationally and in California generally matched the exit poll taken Tuesday for the major television networks and the Associated Press with one big exception: The SurveyMonkey national poll showed a whiter electorate with fewer college graduates.
This year, the exit poll showed the white share of the national electorate shrinking to 70% from the 72% that the exit poll found four years ago. That would continue a trend of a declining white vote. The SurveyMonkey poll, by contrast, indicated that the white share, and especially the share of the voters who were whites without college degrees, went up slightly.
Which numbers are right won’t be known for sure until next year when the Census delivers its findings on who voted. In the past, the Census has found a whiter and less-educated electorate than the exit polls.
The SurveyMonkey finding, however, is more consistent with county-level voting data that show lower turnout in many heavily minority areas, especially African American neighborhoods of major cities, and a strong vote for Trump in areas of the Midwest with large numbers of blue-collar white voters.
A whiter electorate than expected might also explain why polls of battleground states underestimated Trump’s vote: Polling models tended to assume the electorate would resemble the one from four years ago.
The USC/L.A. Times statewide post-election survey has an error estimate of 3 percentage points in either direction for the full sample, larger for subgroups. It was conducted Nov. 9 to -11 among 2,294 registered voters who said they had voted.
Voters were selected from among the roughly 3 million who participate daily in SurveyMonkey polls, and the results were weighted to match Census figures on basic demographics as well as the overall vote.
The national survey, using the same methodology, was conducted among 99,377 registered voters who said they voted and has an error estimate of 0.2 percentage points in either direction for the full sample.
For more on Politics and Policy, follow me @DavidLauter
ALSO
What to make of Trump one week in: He’s unpredictable and keeping his options open
Donald Trump’s transition team loses a key figure as he struggles to find his footing
When Trump says he wants to deport criminals, he means something starkly different than Obama
UPDATES:
6:16 p.m.: This article was updated with the latest number of uncounted votes in California.
This article was originally published at 12:40 p.m.
More to Read
Get the L.A. Times Politics newsletter
Deeply reported insights into legislation, politics and policy from Sacramento, Washington and beyond. In your inbox twice per week.
You may occasionally receive promotional content from the Los Angeles Times.


