Homes Resales Skid 9.5% in State, 6.7% Nationally
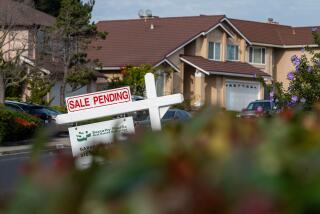
Sales of existing homes plunged 9.5% in California in July, and sales across the country fell as well--not as steeply, but in a marked reversal following five straight months of increases.
Leading the slump in California, where sales had slipped in June, too, were plummeting markets in such inland areas as Sacramento, Riverside and the Central Valley.
Nationally, home sales fell 6.7% in July to a seasonally adjusted annual rate of 3.35 million units, down from 3.59 million in June, according to the National Assn. of Realtors.
Although last month’s sales decline left nationwide home sales 0.9% higher than last year and 0.8% higher than July, 1990, in California, tighter mortgage-lending standards as well as a standoff between buyers and sellers over high home prices are apparently taking their toll on the housing market, experts say.
“The pent-up demand for housing that occurred in April has slowed down because of tighter lending standards,” said James Z. Pugash, director of Montgomery Securities Real Estate in San Francisco. “A lot of builders are telling us that this has become a significant obstacle to home sales.
“There’s also been a shift in the nature of the demand for housing. Most of the activity is at the entry level and at the very high end of the market. . . . In the middle there’s an affordability problem” with few homeowners trading up from less-expensive homes, Pugash said.
Despite the sputtering home sales, which are considered a leading economic indicator, most economists are still predicting a modest economic recovery overall.
Citing a huge 10.7% increase in factory orders for durable goods posted in July, many experts believe that the stimulus for the economy will come from higher overall consumer spending--which accounts for more than 50% of the economy--rather than from home sales, which make up only 3.4% of the nation’s gross national product, according to the Commerce Department. (The GNP is a measure of the value of all goods and services produced in the United States.)
Lower mortgage rates, which began falling earlier this month toward their lowest levels in four years, could help revive home sales, experts say. As of Aug. 23, 30-year, fixed mortgage rates were down to 9.26% nationally and 9.36% in California. Both figures are the lowest since March, 1987, according to HSH Associates, a Butler, N.J.-based publisher of mortgage information.
“If mortgage rates drop, they will only increase housing affordability,” said Harley E. Rouda, president of the National Assn. of Realtors.
Rouda added that a slight rise in home prices suggests that there is less pressure on sellers to lower their prices to consummate sales. The national median price of an existing home sold in July rose to $103,000, or 1% higher than a month earlier and 5% above the year-ago median price of $98,100, the association said.
But consumers seeking home loans are finding fewer major lenders in the market, as banking companies such as BankAmerica Corp. and Security Pacific Corp. merge. What’s more, financial institutions have ended the “easy qualifier” loans of 18 months ago, where home buyers could get a mortgage with as little as 5% down and little documentation of income.
In addition, many consumers no longer believe that owning a home will pay off in the long run.
“I think that there are a lot of people who are questioning the investment potential of homeownership in the 1990s,” said Richard Peach, deputy chief economist of the Mortgage Bankers Assn. in Washington. Instead, he said, some consumers may be opting to put more of their money into the stock market or mutual funds.
Peach cautioned that such an attitude could prove misplaced in the long term as the inventory of housing dwindles, causing home prices to rise rapidly again.
July Home Sales California home sales activity for July*
Percent Percent Percent Percent change change change change in in in sales in sales price price activity activity from from from from June, ’91 July, ’90 June, ’91 July, ’90 Statewide single-family 1.5 7.0 -9.5 0.8 Statewide condo -0.1 0.5 11.4 -2.4 Central Valley 1.3 -3.1 -13.4 -28.5 High Desert** 8.1 4.3 -1.7 -6.3 Los Angeles -1.2 2.4 0.6 16.4 Monterey 5.2 12.8 8.0 44.8 N. California -3.8 -9.1 15.1 -18.4 Wine Country 0.2 2.4 0.4 -9.3 Orange County 1.8 -0.4 7.2 12.9 Palm Springs/ Lower Desert** -5.3 -7.6 -8.4 -16.7 Riverside/ San Bernardino 5.0 5.4 -20.0 -14.8 Sacramento*** 2.2 -3.4 -20.0 -45.9 San Diego 0.8 3.2 7.9 18.0 Bay Area 0.8 1.1 -10.0 -5.9 Santa Barbara** 3.9 3.1 -3.1 -1.1 Santa Clara -1.0 2.7 -10.0 -5.9 Ventura -3.1 -2.4 -6.7 38.3
* Based on closed escrow sales of single-family, detached homes only (no condos). Reported month-to-month changes in sales activity may overstate actual changes because of the small size of individual regional samples. Movements in sales prices should not be interpreted as measuring changes in the cost of a standard home. Prices are influenced by changes in cost and changes in the characteristics and size of homes actually sold.
** Due to the small sample size in these areas, prices and activity changes may be overemphasized.
*** Source: Sacramento Assn. of Realtors.
Regional and Condo Sales Data Not Seasonally Adjusted
Source: California Assn. of Realtors.
Home Prices by Region
July, July, 1991 1990 California $206,670 $193,090 (single-family) California (condo) $145,670 $144,930 Central Valley $121,490 $125,420 High Desert $110,370 $105,810 Los Angeles $220,800 $215,530 Monterey $246,430 $218,480 N. California $132,940 $146,180 Wine Country $188,310 $183,970 Orange County $244,890 $245,890 Palm Springs/ $118,440 $128,150 Lower Desert Riverside/ $140,830 $133,580 San Bernardino Sacramento $140,000 $145,000 San Diego $192,050 $186,180 Bay Area $269,000 $266,120 Santa Barbara $226,140 $219,440 Santa Clara $281,020 $273,600 Ventura $234,300 $240,140
Source: California Assn. of Realtors
Existing Home Sales Seasonally adjusted annual rate, millions of units 1990 July ‘90: 3.32 1991 June ‘91: 3.59 July ‘91: 3.35 Source: National Association of Realtors
More to Read
Inside the business of entertainment
The Wide Shot brings you news, analysis and insights on everything from streaming wars to production — and what it all means for the future.
You may occasionally receive promotional content from the Los Angeles Times.


