How alarming predictions about coronavirus losses in California gave way to guarded optimism
- Share via
The dire predictions from Gov. Gavin Newsom and state public health officials have been steady and unnerving: Millions of Californians would be infected by the coronavirus, hospitals would be overrun, desperate patients could die without ventilators.
But a more optimistic outlook is emerging, with several epidemiological studies suggesting the state is probably at the peak number of daily new cases, as long as social distancing restrictions remain in place.
It was less than a month ago, on March 18, that Newsom wrote a letter to President Trump saying that 25.5 million Californians would be infected within eight weeks. And on April 7, Mark Ghaly, California’s secretary of Health and Human Services, said he believed the state would would need at least an additional 15,000 ventilators to handle the crisis, which he predicted would peak in May or June.
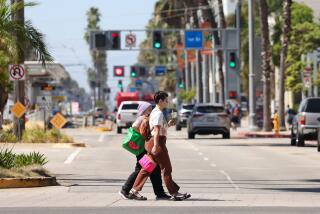
These are some of the unusual new scenes across the Southland during the coronavirus outbreak.
But by Friday, Ghaly’s comments were far less alarming. “Any peak, when it comes, will probably not be significantly higher than today on ICU hospitalizations and overall hospitalizations because we have done all the right things on physical distancing and staying at home,” he said.
On Wednesday, the state for the first time released some of the data behind those earlier warnings that hospitals would be overwhelmed in May. A chart shows a demand for 31,747 beds by May 20. But it also shows that the projections on hospitalizations have so far been hugely overblown, predicting a need for 11,428 beds Tuesday when only 5,065 were actually hospitalized with COVID-19.
A spokeswoman with the state health agency, Kate Folmar, acknowledged that the projections had been off and added that “we are continuously refining our model with researchers and local public health offices.”
She added: “Bear in mind that this is a completely new virus with new patterns. So it’s not the same as modeling the flu or measles.”
Mayor Eric Garcetti has told top city staffers that Los Angeles might prohibit big gatherings until 2021 because of the coronavirus threat.
The governor and his top health advisers have not been alone in painting a bleak picture. Epidemiologists warned that the virus could cause millions of deaths. Doctors and nurses described emergency rooms and intensive care units that could soon be on the brink of chaos. Media outlets issued alarming daily reports of escalating infection counts.
While the threat of infection has diminished, it has by no means disappeared, with well over 1,000 new confirmed cases a day in California over the last week. The state reported a new high of 76 deaths Wednesday, 42 in Los Angeles County alone.
But academic models from London to San Francisco appear to show that California is at the top of the curve for new cases, with the peak in deaths likely following anywhere from one to three weeks behind.
An epidemiological model built by researchers at the London School of Hygiene & Tropical Medicine projected Tuesday that the number of new cases in California were “decreasing” day by day.
And an analysis by UC San Francisco School of Medicine shows most counties in California are seeing a daily decrease in the number of new cases, while some are reporting flat numbers, with only a few still logging increases, said Travis Porco, professor at UCSF’s department of epidemiology and biostatistics and a researcher on the model.
“The powerful flattening is unmistakable,” Porco said. But he said it will take a few more days to know “whether we really are starting to drive it downward.”
The big question ahead is how sharp that downward curve will be. A slow decline could easily mean far more people die after the peak than before. A fast one would mean the opposite. Social distancing will be a critical factor. Lifting restrictions too early would likely lead to dangerous new jumps in cases.
With the current measures in place, the Institute for Health Metrics and Evaluation, or IHME, at the University of Washington shows the current outbreaks in California tapering down to zero new deaths by May 15. Its average estimate has 983 people dying before the peak, and 500 after.
The institute’s model has become a lightning rod, largely for the certainty of its timeline. Yet the world is desperate to answer the paramount question the team confronted: When is this nightmare going to be over?
When can schools and stores open, when can we go back to parks and restaurants, when can we get back to normal life — if still six feet apart, with masks?
But many epidemiologists say it is foolhardy to project that far into the future, with so many uncertainties plugged into the IHME algorithm.
Its early model was based on data from China, where authorities suppress the free flow of information — likely including the true number of cases and deaths — and enforce social restrictions in draconian ways unheard of in the United States.
“This appearance of certainty is seductive when the world is desperate to know what lies ahead,” wrote UC Berkeley biostatistician Nicholas Jewell in a critique he co-authored. He added that IHME has not released the complete methodology behind their model either, making it impossible for other scientists to check its validity.
“The underlying data and statistical model must be interpreted cautiously,” he said,
California and its local governments are selective about what information they provide about the coronavirus crisis. What does the public have a right to know, and why is some information being held back?
But while many epidemiologists criticize the IHME model as too optimistic, it has at times, to this point, been too pessimistic.
On March 26, the center forecast 6,109 deaths in California during this outbreak, with daily deaths rising to a peak of nearly 150. As researchers added better data to its algorithm, its projected death total for the state has fallen to 1,483, with a range of uncertainty between 852 and 3,143. They project the peak day for deaths to be Sunday, with 52 deaths, and a range of uncertainty between eight and 192.
Those large uncertainties and big changes in results, as new data came in, have only fueled outside criticism.
Dr. Theo Vos, professor of health metrics sciences at IHME, acknowledges the objections from his fellow epidemiologist and bio-statisticians. The numbers jump above and below their projection but, he said, “they’ve always been within the large uncertainty that we estimate.”
Vos said his team is looking at the general path of the virus.
“I think we are the only group that has been even within a reasonable distance of predicting the shape of the epidemic,” he said. “All these other models had these doomsday scenarios where the virus would go wild, it would end up infecting you know, 70 to 80% of the population and we would have millions and millions of deaths. Obviously that hasn’t happened.”
The London School of Hygiene and Tropical Medicine is a more classic model, following infection rates, not deaths, without projecting into the future.
On Tuesday, the London model had issued a “likely decreasing” finding for the illness in California. On Wednesday its data was solid enough to confirm it was in fact decreasing.
The British researchers use four factors to determine the “effective reproductive number” of the disease — including how long someone is infectious and the expected number of daily contacts of each individual.
When the effective reproductive number is 1, that means that every infected person will likely infect one more person while they are contagious. When the number falls below that, the epidemic is on the decline. When each person is infecting two or three people, or more, it’s rising exponentially.
Washington, the first American state to confirm a case of SARS-CoV-2, moved quickly to send its population into isolation and was the first state to see its reproductive number fall below 1. Two other early hot spots, Louisiana and Michigan, dropped below 1 days later, and California did by Wednesday, the researchers reported.
The model shows several other states where infection rates are still increasing: Illinois, Massachusetts, Rhode Island, Wyoming, Montana, North Dakota and South Dakota. Many other states are in the “likely increasing” category. And the researchers have not been able to obtain enough data to make a projection in more than 20 American states.
One of the most influential models was designed by Imperial College in London, which found in mid-March that — without intervention — about 2.2 million people in the U.S. would die over the course of the outbreak.
Testifying before a Parliamentary committee nine days after his explosive report, epidemiologist Neil Ferguson clarified that the death rates would be enormously reduced by the kinds of restrictions the U.K. and other governments had put in place. He said the worst-case total of 500,000 British dead could drop to 20,000, or fewer.
A simple calculation shows that the same percentage drop in the U.S. would result in about 88,000 deaths.
Whether it’s that terrible toll, better, or worse, will all depend on the pitch of that downward curve.
Times staff writers Taryn Luna and Rong-Gong Lin II contributed to this report.
More to Read
Sign up for Essential California
The most important California stories and recommendations in your inbox every morning.
You may occasionally receive promotional content from the Los Angeles Times.
